
Metrum AIHeterogeneous Inference

Key results

  1. Concurrency within the latency target

    p90 time to first token at or under 2 s

    3.2×higher

    Round robin65
    llm-d208
  2. Time to first token

    p90 at the same concurrency, about 65

    5.3×faster

    Round robin1.70s
    llm-d0.32s
  3. Output throughput

    Peak tokens per second across the pool

    1.3×higher

    Round robin2,502tok/s
    llm-d3,249tok/s
  4. Prefix cache reuse

    Requests with their prefix cached, at the highest concurrency in target

    4.0×higher

    Round robin22%
    llm-d89%
  5. Energy efficiency

    Output tokens per joule, all four GPUs

    1.1×higher

    Round robin1.23tok/J
    llm-d1.35tok/J

How each router places requests

Current promptBClassify this support ticket

  • Prefix in cache, 0.21 s
  • Full prefill, 0.65 s
Fig 1Standard round robin
Prefix cached
0%
Last TTFT
0.65s

Kubernetes sends each request to the next GPU in turn.

Fig 2llm-d
Prefix cached
67%
Last TTFT
0.21s

llm-d sends each prefix to the GPU that already holds it.

System under test

Same hardware, model and prompts for both routers

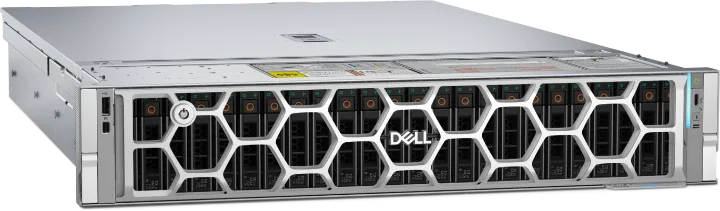
  • Dell PowerEdge R7725 rack server, front view

    2× Dell PowerEdge R7725

    2× AMD EPYC 9965, 384 cores per server

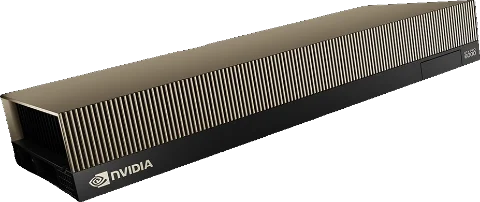
  • NVIDIA RTX PRO 6000 Blackwell GPU

    2× RTX PRO 6000

    NVIDIA Blackwell, 96 GB

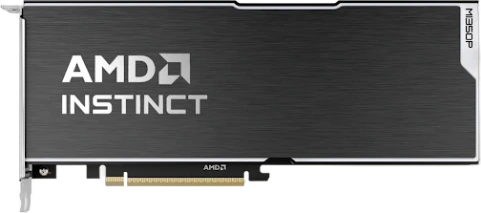
  • AMD Instinct MI350P PCIe GPU card

    2× Instinct MI350P

    AMD, 144 GB HBM3E

Qwen3.8-27B on vLLM 0.31, one serving per GPU, prefix caching on

Supporting measurements

Medians of three runs, measured 2 Nov 2026. Each router served 26,280 requests.

Supporting measurements
MeasureStandard round robinllm-dDifference
Median time to first token at concurrency about 650.77 s0.22 s3.6× faster
p90 time to first token at each router's highest concurrency within the target1.70 s at 651.10 s at 2083.2× the concurrency
Concurrency at peak throughput721208llm-d peaks earlier and higher
Prompt tokens computed in prefill188.8 M135.2 M28% fewer
GPU energy per output token0.816 J0.739 J9% less
Mean pool power over the run1.51 kW1.45 kWSimilar draw
Failed requests1 of 26,2800 of 26,280Both runs complete

Results by concurrency

Each point is one 60-second load step, the median of three runs. Concurrency is the average number of requests sent and not yet finished during the step. Dotted lines mark each router's highest concurrency within the target.

Time to first token

p90 per load step, seconds, log scale

  • Round robin
  • llm-d
0.101.0101001,00010,00010301003001,0003,000Concurrency, log scalep90 TTFT (s)2 s target
Time to first token, p90 per load step, seconds, log scale
Load stepStandard round robinllm-d
10.78 s at concurrency 110.25 s at concurrency 10
21.05 s at concurrency 200.29 s at concurrency 18
31.38 s at concurrency 350.26 s at concurrency 30
41.14 s at concurrency 490.28 s at concurrency 41
51.70 s at concurrency 650.35 s at concurrency 53
62.83 s at concurrency 840.32 s at concurrency 63
73.31 s at concurrency 1000.38 s at concurrency 82
85.57 s at concurrency 1480.38 s at concurrency 94
910.48 s at concurrency 2320.52 s at concurrency 124
1068.25 s at concurrency 4501.10 s at concurrency 208
11185.10 s at concurrency 72147.96 s at concurrency 297
12293.39 s at concurrency 943205.13 s at concurrency 454
13502.06 s at concurrency 1,328367.08 s at concurrency 793
14825.32 s at concurrency 1,967692.35 s at concurrency 1,481
151,272.07 s at concurrency 2,8571,114.89 s at concurrency 2,351
161,804.95 s at concurrency 3,9261,636.53 s at concurrency 3,386
172,539.12 s at concurrency 5,3562,260.20 s at concurrency 4,753

Output throughput

Tokens per second across the pool

  • Round robin
  • llm-d
01,2502,5003,7505,00010301003001,0003,000Concurrency, log scaleTokens per second
Output throughput, Tokens per second across the pool
Load stepStandard round robinllm-d
1461 tok/s at concurrency 11468 tok/s at concurrency 10
2803 tok/s at concurrency 20821 tok/s at concurrency 18
31,216 tok/s at concurrency 351,266 tok/s at concurrency 30
41,463 tok/s at concurrency 491,589 tok/s at concurrency 41
51,765 tok/s at concurrency 651,955 tok/s at concurrency 53
61,954 tok/s at concurrency 842,252 tok/s at concurrency 63
71,688 tok/s at concurrency 1002,511 tok/s at concurrency 82
81,997 tok/s at concurrency 1482,796 tok/s at concurrency 94
91,842 tok/s at concurrency 2322,826 tok/s at concurrency 124
102,313 tok/s at concurrency 4503,249 tok/s at concurrency 208
112,502 tok/s at concurrency 7213,178 tok/s at concurrency 297
122,378 tok/s at concurrency 9433,131 tok/s at concurrency 454
132,261 tok/s at concurrency 1,3282,917 tok/s at concurrency 793
142,326 tok/s at concurrency 1,9673,020 tok/s at concurrency 1,481
152,336 tok/s at concurrency 2,8572,679 tok/s at concurrency 2,351
162,322 tok/s at concurrency 3,9262,353 tok/s at concurrency 3,386
172,272 tok/s at concurrency 5,3562,352 tok/s at concurrency 4,753

Prefix cache reuse

Share of requests whose prefix was already cached

  • Round robin
  • llm-d
025507510010301003001,0003,000Concurrency, log scaleRequests cached (%)
Prefix cache reuse, Share of requests whose prefix was already cached
Load stepStandard round robinllm-d
127 % at concurrency 1197 % at concurrency 10
222 % at concurrency 2093 % at concurrency 18
319 % at concurrency 3599 % at concurrency 30
425 % at concurrency 4998 % at concurrency 41
522 % at concurrency 6596 % at concurrency 53
619 % at concurrency 8498 % at concurrency 63
717 % at concurrency 10094 % at concurrency 82
819 % at concurrency 14897 % at concurrency 94
916 % at concurrency 23295 % at concurrency 124
1010 % at concurrency 45089 % at concurrency 208
111 % at concurrency 72169 % at concurrency 297
122 % at concurrency 94353 % at concurrency 454
131 % at concurrency 1,32840 % at concurrency 793
142 % at concurrency 1,9677 % at concurrency 1,481
152 % at concurrency 2,85711 % at concurrency 2,351
162 % at concurrency 3,92612 % at concurrency 3,386
172 % at concurrency 5,35615 % at concurrency 4,753

Energy efficiency

Output tokens per joule in each load step, all four GPUs

  • Round robin
  • llm-d
0.00.61.21.82.410301003001,0003,000Concurrency, log scaleTokens per joule
Energy efficiency, Output tokens per joule in each load step, all four GPUs
Load stepStandard round robinllm-d
10.40 tok/J at concurrency 110.40 tok/J at concurrency 10
20.61 tok/J at concurrency 200.65 tok/J at concurrency 18
30.90 tok/J at concurrency 351.00 tok/J at concurrency 30
41.03 tok/J at concurrency 491.22 tok/J at concurrency 41
51.18 tok/J at concurrency 651.44 tok/J at concurrency 53
61.27 tok/J at concurrency 841.63 tok/J at concurrency 63
71.08 tok/J at concurrency 1001.73 tok/J at concurrency 82
81.26 tok/J at concurrency 1481.85 tok/J at concurrency 94
91.13 tok/J at concurrency 2321.88 tok/J at concurrency 124
101.38 tok/J at concurrency 4502.00 tok/J at concurrency 208
111.46 tok/J at concurrency 7211.93 tok/J at concurrency 297
121.35 tok/J at concurrency 9431.92 tok/J at concurrency 454
131.32 tok/J at concurrency 1,3281.74 tok/J at concurrency 793
141.40 tok/J at concurrency 1,9671.76 tok/J at concurrency 1,481
151.34 tok/J at concurrency 2,8571.53 tok/J at concurrency 2,351
161.32 tok/J at concurrency 3,9261.39 tok/J at concurrency 3,386
171.34 tok/J at concurrency 5,3561.38 tok/J at concurrency 4,753

Where the work ran

The pool has two GPU types. The bars show how each router spread the work across them.

KV cache in use, by GPU type

  • 2× NVIDIA RTX PRO 6000
  • 2× AMD Instinct MI350P
Round robin15 % of pool KV in use
llm-d38 % of pool KV in use

Measured at each router's highest concurrency within the target: 65 for round robin, 208 for llm-d. The AMD pair holds 62% of the pool's KV memory, and the dashed line marks that split.

Pool power

Mean GPU power across all four GPUs over the run

Round robin1.51 kW
llm-d1.45 kW

Both routers draw about the same power. llm-d turns more of it into output: 0.739 J per token against 0.816 J for round robin.

Full configuration

Both routers ran on the same servers with the same serving flags. Only the router in front of the four GPUs changed.

Servers, GPUs and serving configuration
ItemNode 1Node 2
ServerDell PowerEdge R7725Dell PowerEdge R7725
GPUs2× NVIDIA RTX PRO 6000 Blackwell, 96 GB each2× AMD Instinct MI350P, 144 GB HBM3E each
CPUs2× AMD EPYC 9965, 384 cores2× AMD EPYC 9965, 384 cores
Memory1.5 TB DDR5-64001.5 TB DDR5-6400
Storage3× 3.84 TB NVMe4× 3.84 TB NVMe
Network1 GbE and a 400 GbE NIC1 GbE and a 400 GbE NIC
Kubernetes rolek3s server, control plane and routerk3s agent
Checkpointnvidia/Qwen3.8-27B-NVFP4amd/Qwen3.8-27B-Quark-AWQ-MXFP4
PrecisionNVFP4 MLP, FP8 attentionMXFP4 weights and activations
RuntimevLLM 0.31, CUDA 13.2vLLM 0.31, ROCm 10.1
Context served16,384 tokens16,384 tokens
Tensor parallel1 per serving, 2 servings1 per serving, 2 servings
Prefix cachingOn, identical for both routersOn, identical for both routers

GPU memory per GPU

Each vendor loads its own FP4 build of the same model. Weights take about 20 GB on both, and the rest holds KV cache.

  • Model weights
  • KV cache and headroom
NVIDIA RTX PRO 600096 GB
AMD Instinct MI350P144 GB